Pricing Research
Gabor-Granger: How to Find the Price That Maximises Revenue
The method, the price ladder, how to build the demand and revenue curves, the sample size you need, and where Gabor-Granger beats Van Westendorp. With a worked example.
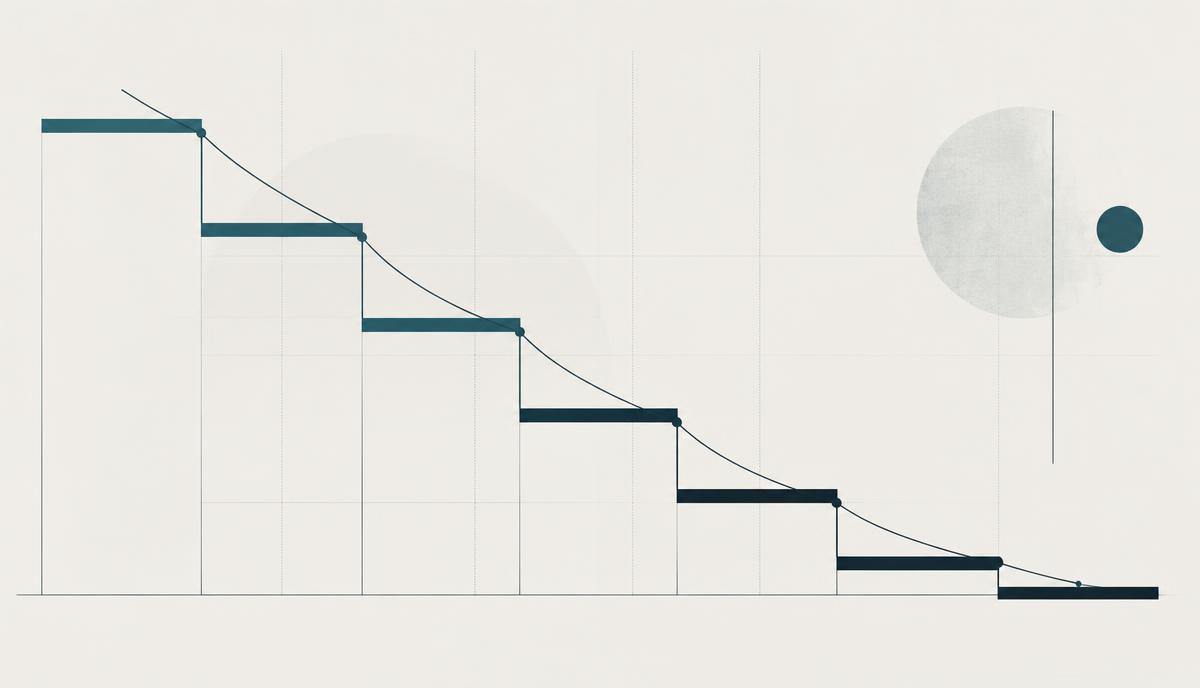
Gabor-Granger answers the question Van Westendorp cannot: of the prices your market finds acceptable, which one makes you the most money. You test specific price points, measure purchase intent at each, and build a demand curve and a revenue curve from the answers.
It is the more decision-ready of the two classic willingness-to-pay techniques, and it is the one to reach for once you have a range and need a number.
How the method works
Respondents see a precise description of the product, including what is included and the billing period, then face a single price: would you buy at this price? Depending on the answer, the next price moves up or down a defined ladder, and the sequence continues until their acceptance threshold is found.
Aggregate those thresholds and you get the share of respondents who would buy at each tested price. That share is your demand curve. Multiply share by price and you get the revenue curve, which peaks at the revenue-maximising price point.
Designing the price ladder
The ladder is the study. Get it wrong and the output is a well-presented artefact of your own assumptions.
- Cover a wide enough range. Include prices above what you think the market will bear. If the highest point still gets strong acceptance, you have learned nothing about your ceiling and have to run it again.
- Use realistic increments. Round, market-plausible steps. Five to seven points is usually enough.
- Randomise the starting point. Always opening at the same price anchors respondents and drags the whole curve toward it.
- Price the unit you actually sell. Per seat per month, per 1,000 runs, per resolved ticket. Mixing units makes the curve meaningless.
A worked example
An AI support product tests five monthly prices with 300 qualified buyers. Acceptance comes out at 78 percent at 200 dollars, 61 percent at 300, 44 percent at 400, 24 percent at 500, and 11 percent at 650.
Indexed revenue per 100 respondents is 156 at 200, 183 at 300, 176 at 400, 120 at 500, and 72 at 650. Demand falls throughout, as it should, but revenue peaks at 300 and stays close at 400.
The decision is not automatic. If your cost to serve is meaningful, 400 dollars can beat 300 on profit even though it loses on revenue, because you serve fewer, better-qualified accounts. Always run the curve twice: once on revenue, once on contribution after cost to serve.
Sample size and quality
You need a few hundred qualified respondents for stable curves, and each segment you plan to price separately needs its own usable sample. Screen hard for buying authority. Gabor-Granger is more sensitive than most methods to non-buyers, because a person with no budget will happily accept a low price and reject a high one, flattening your curve exactly where the decision lives.
Known limitations
- Stated intent overstates behaviour. Expect absolute acceptance rates to be optimistic. Treat the shape of the curve and the location of the peak as the finding, not the percentages.
- No competitive context. Respondents price your product in isolation. If your category has a well-known reference price, put it in the stimulus.
- One product, one price. Gabor-Granger does not evaluate a tier structure or trade-offs between features. It prices a single defined offer at a time; run it per tier.
- Ladder anchoring. Sequential prices influence each other. Randomised starts and clean increments limit this, they do not eliminate it.
Gabor-Granger or Van Westendorp
Use Van Westendorp early, when you have no idea what the market considers reasonable and you need a defensible range. Use Gabor-Granger when you have that range and need to choose a point inside it, or when you are validating a planned increase.
Run them together and each covers the other's weakness: Van Westendorp bounds the space and flags the too-cheap floor, Gabor-Granger finds the revenue peak inside it. In practice the sequence is four questions to set the band, then a ladder inside the band to set the price.
Turning the curve into a price
Three steps. Rebuild the revenue curve as a contribution curve using your real cost to serve per account. Check the peak against your positioning: if you are the differentiated option and the peak sits mid-range, you are probably under-selling the value story rather than over-pricing. Then pick the point, write down the packaging that justifies it, and set a review date.
For AI products, add one more check: model your cost per unit at the top of the usage distribution, not the average, before you commit to a point on the curve. A price that maximises revenue at average usage can be loss-making in the tail. That is where outcome-based structures and floors earn their place, and where the wider comparison of SaaS pricing models helps you check you are testing the right unit.
See how we apply empirical pricing research in practice: Explore the C.O.R.E. roadmap & 78-artifact catalog